
CREATING A KEY PERFORMANCE INDICATOR (KPI) & SPECIFYING GOALS IN SAP B1

KPIs are quantifiable measurements that reflect critical success factors in a company, such as targets for revenue or profit margin. SAP provides you with a number of predefined KPI cockpit widgets. There are two main benefits to using KPIs. KPIs allow you to easily and quickly check progress towards achieving your company’s strategic goals and objectives. The ability to create your own KPIs gives you the option to design financial and operational KPIs that reflect your own unique business. You can edit the existing KPIs or create your own in the Pervasive Analytics Designer.
KPI& specifying goals to be measurable :
Let’s look at the example of creating a custom KPI for measuring overdue deliveries each month. The KPI target will be to reduce overdue deliveries to 1 or 0 per month. Since the numbers have typically been much higher, the KPI should also visually alert us if we are approaching the target with a range of 2-5 per month.
To create KPI, Open the Pervasive Analytics Designer and choose the option to create a KPI. Enter a name for the KPI and a description on the ‘Settings’ tab. Give the new KPI a descriptive name because this name will appear in the KPI widget.
The KPI Definition shows all existing user-defined queries, analytic views and calculation views for you to choose as the basis of your KPI.
Open the query or view to see the measures and dimensions. Drag a measure from the data source definition to the first box in the ‘Set KPI Value’ area. Then use the dropdown box to choose the appropriate unit.
In our example we use a query that compares actual delivery dates to the expected delivery dates as the data source. We choose the measure ‘Count’. This measure will give us a count of deliveries where the actual date was later than the expected delivery date. In our case, we do not need a unit, but some measures may use a date. For example, if you were counting the number of days late, then Day would be the unit.
Next you choose a dimension from the same query and drag the dimension to the ‘Set KPI Value’ area. Use the dropdown box to choose granularity of the dimension.
In our example, we want to measure whether we have met the all expected delivery dates for sales orders within a month. Therefore, we choose the dimension ‘Expected Delivery Date’ and use the dropdown to choose ‘Month’.
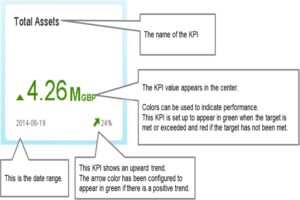
Notice that as you fine-tune the definition, the example of how it will look changes with your definition. Adding a time dimension allows the KPI to display a trend.

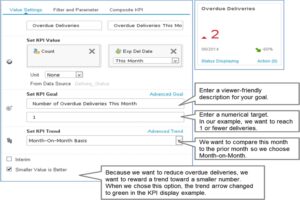
Once you have the base measure and dimension, you can begin to specify how to know when you have reached your goal and how to measure the trends. Some KPIs, like those that measure revenue are considered to be improving as the number rises. However, others like overdue deliveries are improving as the number falls. You also choose which period you compare the current results to. For example, you may want to measure overdue deliveries this month to last month, whereas you may wish to measure revenue this month compared to the same month in the prior year. All these settings are possible for KPIs. You make the following settings in the ‘Value Settings’ tab, the same tab where you defined the base measure and dimension.
- KPI Goal Description – enter a description that makes it easy for viewers to understand your goal.
- Target – enter a numerical value for the unit of the measure you have chosen.
- Trend – compare to the prior period (for example Month-on-Month) or compare to the same period in the prior year (Month over Month).
- Smaller is Better – select this checkbox if the goal is a smaller number rather than a larger one. For example, with overdue deliveries: fewer are better.
You can add more complexity in setting goals and trends by using the advanced goals and trends area.
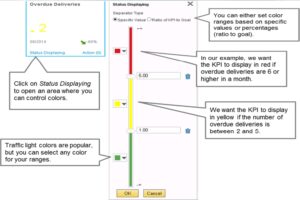
You saw how the choices we made in the KPI definition changed the color of the KPI in the examples in the previous figures. You can choose which colors you wish to use for the display and set ranges for when the colors are used.
Get started today.
Visit: www.emerging-alliance.com